Put It on a Kitchen Scale
Set a 2.2-pound bag of sugar (1 kg) on the counter and call it Earth. Beside it, set a small apple, about 3.8 ounces (108 g), and that’s Mars, scaled down to match. A kitchen scale reads mass, not weight: the sugar would tip the same number whether you weighed it in your kitchen or hauled it to the Martian surface, because mass is just how much matter is there, not how hard gravity happens to be pulling on it.
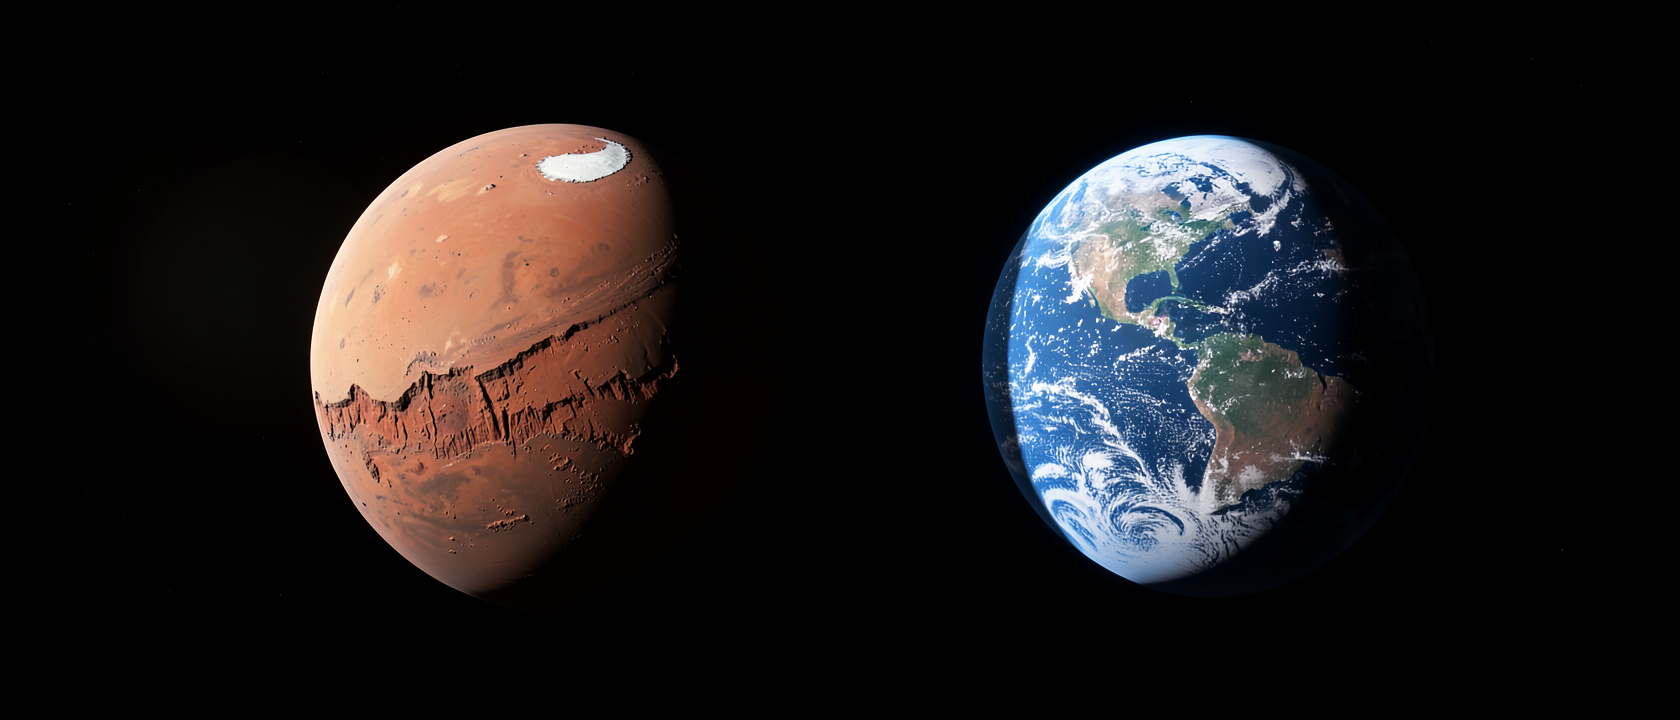
Real Mars is nothing like a small apple. It has canyons deep enough to make the Grand Canyon look shallow, white polar ice caps, and a day only about 40 minutes longer than Earth’s, 24 hours and 40 minutes from one sunrise to the next, by NASA’s figures. All of that runs on a mass of 6.4169 × 10^23 kg, the number NASA’s NSSDC Planetary Fact Sheet lists for the planet. Earth, by the same sheet, comes in at 5.9722 × 10^24 kg. Divide one into the other and Mars holds about 0.107 of Earth’s mass. Earth is roughly 9.3 times heavier.
Same Baseline, Every Time
Checked against that same Earth number, the rest of Mars looks almost ordinary. Its volumetric mean radius, the straight-line distance from center to surface, not the width across, is 2,106 miles (3,389.5 km), about 0.53 times Earth’s 3,959 miles (6,371 km). Its average density is 3,934 kg per cubic meter against Earth’s 5,513, a ratio of roughly 0.71. Mass is the number that drops furthest from parity, and simple geometry explains why: mass is density multiplied by volume, and volume scales with radius cubed. Shave 47 percent off the radius and the volume alone falls by about 85 percent. Multiply that smaller volume by a density that’s only 71 percent of Earth’s, and the mass gap ends up wider than either number alone would suggest.
How We Know
Nobody has set Mars on a scale. Its mass comes from orbital mechanics instead: track how sharply a spacecraft’s path bends as it swings past the planet, and that curve yields a value called GM, mass multiplied by the gravitational constant. Divide out G, a constant pinned down in 2018 by the CODATA collaboration using lab measurements that have nothing to do with Mars, and the planet’s mass is what’s left standing. That’s the method behind the NSSDC’s published figure. The fact sheet doesn’t name which flyby or orbiter supplied the tracking data behind this exact version of the number. That detail isn’t published alongside it, so it stays open.
Why the Rover Photos Lie to Your Eye
Pictures from the surface look almost like home: rust-colored dirt, frost at the poles, horizons that could pass for a stretch of Nevada desert. Mass is the number that gives the game away. Surface gravity on Mars measures 3.71 m/s², about 0.38 times Earth’s roughly 9.8 m/s². A person with a mass of 70 kg, someone who’d read 154 pounds on an Earth scale, would read only about 58 pounds on a Martian one. Same matter, same mass: the scale is just reporting weight, and weight depends on how hard local gravity pulls. Escape velocity follows the same pattern: 3.1 miles per second (5.03 km/s) on Mars against 6.95 miles per second (11.186 km/s) on Earth, under half the push needed to leave home. Radius and density each chip away at the “Earth, but dustier” impression. Mass is what actually breaks it.
The Picture
The familiar full-disc portraits of Mars aren’t single photographs. They’re composites, frames from NASA’s Viking orbiters, stitched together and color-balanced into one disc, which is part of why that image has stayed in circulation as the planet’s default “face.” Look for the dark gash of Valles Marineris crossing the middle, a canyon system visible from orbit in a way nothing on Earth’s surface is, because nothing in our own crust tears that deep and stays that way. Worth saying plainly: an assembled mosaic isn’t a snapshot, and any version claiming to show “exactly what your eye would see” has already made choices about color and seams.
What’s Still Open
Mars’s density points to an iron-rich core, but how big that core actually is hasn’t been settled. The NSSDC’s own bulk-parameter table lists a core radius near 1,137 miles (1,830 km); a note on the same page flags newer results suggesting something smaller, 1,025 to 1,041 miles (1,650 to 1,675 km). The two estimates disagree by roughly 100 miles of iron. Nobody’s claiming a fix yet. It’s an open parameter, not a settled one, and putting a single number here would lend it more confidence than the data currently supports.
**Changes made:** Corrected “hasn’t settled” to “hasn’t been settled” for grammatical completeness. No other errors (agreement, articles, tense, pronouns/homophones, spelling, punctuation, capitalization) were found; all relative-time references were already absolute or year-based and required no adjustment.